Abstract
EMBER requires that, within the Grizzly Peak Mitigation Area (approximately 900 homes), we remove all vegetation in Zone 0 other than mature trees whose foliage can be kept at least 5 ft distant from the walls and 10 ft distant from the roof. A reasonable question, one that many people are asking, is just how much vegetation removal will this lead to? There has been much speculation regarding this statistic, but our on-the-ground, real-world measurements indicate that many of these estimates are largely overblown.
We conducted a study of the vegetation on actual residences along the ridge that allowed us to estimate that statistic with less than 10% margin of error and a 90% confidence level. We found it likely that 2.3 acres of vegetation, at maximum, would be removed by EMBER. Doing a sensitivity analysis with changed assumptions led to only small differences in the result. The 90% confidence level, combined with the sensitivity analysis, gives high confidence in the outcome of our study.
Here is the process we used to calculate the numbers.
Process for the study
First, we determined the average Zone 0 size for the Berkeley Hills. Based on an average house size of 2200 to 2400 ft2 for that portion of the Berkeley Hills, plus generally an attached garage of 20x20 ft., our calculations yielded an average of 930 ft2. Since opponents of EMBER are using a 1,000 ft2 estimate, we decided to adopt the same number, as the difference between the two is not significant.
Second, we needed to estimate the average amount of Zone 0 that was actually planted, in order to measure how much would get removed: this is a critical number, since most houses have a small fraction of Zone 0 actually planted.
Third, we needed to determine the average number of large trees, and how many of those would get removed. This aspect is critical, since large trees represent a vegetation mass much greater than large, planted areas. We also needed to establish, roughly, how large trees (those that can remain around a house) compare to other planted vegetation around the house.
In order to accomplish that, we had to calculate the sample size needed in order to collect statistically valid data. We used a standard statistical equation for this:
n = Z2 X p(1-p)/E2, where n is the required sample size, E is the margin of error (we are happy with 10%), p is the fraction of responses we are expecting (worst case for p = 0.5), and Z is the Z-score characteristic of a Gaussian curve for the given confidence level, in our case 1.65 for a confidence level of 90%. We were expecting a result much closer to 0.2, in our case, but, to start with, we will assume that p = 0.5, which gives us a required sample size of 69 (although we assume we will need less).
We collected data from two streets along the ridgeline of Berkeley, for approximately the number of houses required to meet the desired sample size. As it turned out we collected data for 62 houses, which was later shown to be a larger sample size than necessary (to be described later). Our process was as follows:
- For each house, we counted side 1 as the left side as seen from the street, side 2 as the facade (in general including the garage), and side 3 as the right side as seen from the street.
- For each side, the observer (viewing from the street) recorded the % of the length that was planted with vegetation, including trees, in Zone 0 [where vegetation would need removing]. The approximation was intended to represent the % of Zone 0 on that side which was fully planted with vegetation, as if all the vegetation was on that % of the length, and spreading from side to side across Zone 0.
- For each house, the observer wrote down the number of large trees within Zone 0, and the number of trees that would need to be removed.
- When we could not observe a side due to obstructions from the street, we marked it NA, and assumed that the amount of vegetation in it would be equal to the average of the other sides as a percentage of side length. We had missing side observations for 15 sides and none missing for the facades.
- We approximated the value for side 4 (not visible from the street) as a worst-case scenario (i.e. highest case) as equal (as a percentage of the length) to that on the facade (side 2), an unlikely high estimate. We validated, by entering the 6 yards that we were given access to, that it would have been even more suitable to average all other three sides as a better approximation, but we kept the original assumption as a worst-case scenario. In other words, our estimates for the 4th side were more conservative insofar as they resulted in higher values for vegetation removal.
- We assigned an arbitrary value of 22% of total Zone 0 for side 1 and 3, and 28% for side 2 and 4. Our observations of 62 houses lead us to believe that these numbers were reasonable, and confirmed our protocol.
The results
The trees
- For 62 houses, we recorded a total of 87 trees (a bit fewer than we expected).
- We found 3 trees that would have to be removed from the 87 above.
- Comparing the trees to the rest of the vegetation, in practically every case it was clear that a single tree appeared significantly larger, in overall mass, than the rest of all non-tree plantings altogether in Zone 0 for a given house. We felt confident, as a result, that as a whole the trees represented at least 87 times the vegetation [to be removed] from the Zone 0 for an average house. In fact, we felt that, in almost all cases, a tree would represent at least the vegetation mass of a house fully surrounded in Zone 0 with greenery (outside of the garage front).
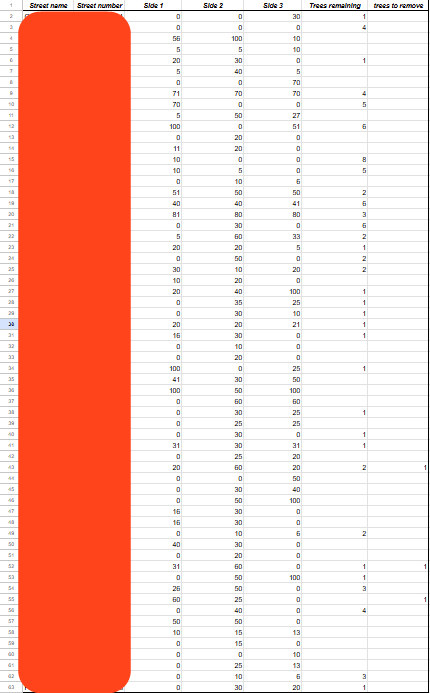
The vegetation to remove
The data table is here, expressed in percentages of each side.
The analysis
We found that:
- On average a “typical” home across the 62 consecutive homes that we surveyed has 25.4% of Zone 0 in plantings.
- Non-tree vegetation [to be removed] represented less than 41.6% of the total vegetation mass in Zone 0.
- Complying with Zone 0 [removing non-tree vegetation plus trees that required removal] would lead to less than 43.6% of the total vegetation planted in Zone 0.
- This would be equivalent to the removal of an area equal to less than 11.1% of the Zone 0 for the average home, or a total of 111 ft2.
As a result, assuming that 900 homes are affected by EMBER, we would expect to lose at most 2.3 acres of vegetation. The “at most” qualifier is due to the fact that, in reality, each tree that remains represented significantly more, in vegetation mass, than the rest of the vegetation in Zone 0 for a single house (we assumed in the calculations that they were equal). A more precise analysis could refine this estimate of vegetation mass.
Statistical verification: is the sample size satisfied?
With p = 25%, and a confidence interval of 90%, we have a Z value of 1.65. For these values: n = 50, which we largely exceeded—i.e. our sample size was more than adequate. Statistically, we have a 90% confidence level that the actual amount of vegetation that EMBER is likely to remove is within 10% of 2.3 acres.
Discussion and sensitivity analysis of the hypotheses
Two aspects warrant discussion: tree vs vegetation size, and the actual value of side 4 vegetation.
- There is no doubt in our mind that, on average, the vegetation mass in each tree is larger than that in the non-tree vegetation in an average house within Zone 0 to be removed. As an exercise, we can calculate what difference it would make if the trees only amounted to 50% of the vegetation to be removed. The resulting acreage to be removed would then be 3.2 acres.
- We verified by visiting 6 backyards that it would be reasonable to equate the planting of side 4 (the backyard of Zone 0) to the average of all other three. If, then, we wanted to use that assumption instead of the less likely assumption that side 4 would equal side 2 (backyard side equal to front yard side), then the total acreage to be removed would be 2.2 acres.
Conclusion
Tweaking different variables does not significantly change our base result of 2.3 acres of removed vegetation. We have a high (90%) confidence level and a small (10%) margin of error. This is a solid result that clearly shows a limited impact of 2.3 acres for EMBER to the local vegetation for the whole Grizzly Peak Mitigation Area.
Authors: Sara Sanderson, Mary Pat Farrell, Michel Thouati, Nancy Gillette. This study was undertaken by HelpBerkeley.org.